The Genetic Structure of Anatolia: From the Neolithic to the Oghuz Migrations
Anatolia has witnessed many migrations and has been home to a variety of civilizations. The increasing availability of ancient DNA samples from different periods and cultures makes it now possible to examine the genetic changes that have taken place in Anatolia since the Neolithic. The ancient DNA revolution has already dispelled many myths, but myths and legends die hard. Some of the more persistent ones concern the impact of the last migration wave to hit Anatolia, marked by the arrival of the Oghuz Turks. While the Oghuz’ cultural impact is undeniable, the significance of their genetic legacy is still contested by some. Although there are still some missing links in the DNA record, the available evidence allows us to put the “no true Turkmen fallacy” to the test.
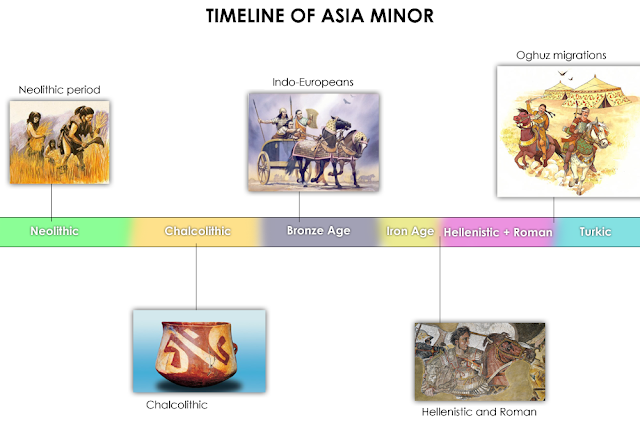
Anatolia_Neolithic: Neolithic sample from central Anatolia (Tep002, Tepecik-Çiftlik, 6680-6590 BC).
Anatolia_Chalcolithic: Chalcolithic sample from western Anatolia (I1584, Barcın, 3943-3708 BC).
Anatolia_Bronze_Age: Bronze Age sample from western Anatolia (I2683, Harmanören-Göndürle, 2500-1800 BC).
Greek_Cappadocia: Average of Cappadocian Greek samples from our project databese.
Turk_Cappadocia: Average of Cappadocian Turkish samples from our project databese.
Turk_Anatolia: Average of all Anatolian Turkish samples from our project database. Due to its inclusion of hunter-gatherer and farmer related components, I’ve thought it would be appropriate to start with the puntDNAL K12 calculator.

Neolithic to Chalcolitic transition: We see a dramatic decrease in the Anatolian_Neolithic component in the Chalcolithic sample, and an increase in the Caucasus_HG component. This change seems to be caused by a large-scale migration of people heavy in Caucasus_HG/Iran_N ancestry.
Chalcolithic to Bronze Age transition: The low quality of this sample causes the admixture results to be quite noisy, but an increase in the Near_East component can be observed. Lazaridis 2016 determined that the Bronze Age sample can be best modelled as a three-way mix of 62% Anatolia_N + 32% CHG + 6% Levant_N.
Let’s continue with the Eurogenes K13 calculator.

If we assume that our modern-day Cappadocian Greek average is representative of the genetic profile of Cappadocian Greeks during the times of the Byzantine Empire, then we can conclude that the Oghuz migrations, which started in the 11th century and continued for hundreds of years, had a significant impact on the genetic structure of Anatolia.
The differences we observe between our samples of Cappadocian Greeks and Cappadocian Turks allows us to gain some insights into the genetic profile of the incoming Oghuz Turks:
- From the observation that Anatolia_Neolithic related components (such as West_Med and East_Med) show significant declines, while the West_Asian component doesn’t, we can deduce that this component was one of the major components that the Seljuk era Oghuz brought with them.
- The increase that we can see in the Baltic component is not surprising, given that modern Central Asians have greater amounts of Baltic admixture than West Asians.
- The fact that the proportions of the West Asian component barely changed, while at the same time the South_Asian component (a proxy for Iran_N related ancestry) increased, indicates that we should focus on the region south of the Aral Sea.
Let’s add a couple of samples from the south of the Aral Sea.
Turkmen_TM: Average of Turkmen samples from Turkmenistan (Ashgabat).
Turkmen_UZ: Average of Turkmen samples from Uzbekistan.
Uzbek_UZ: Average of Uzbek samples from Uzbekistan.


We can take a look at the closest populations for some of our sample averages with the help of the 4-Ancestors Oracle. The numbers to the right of the population names (@ x) are least-squares distances, the smaller the numbers the closer the populations are to each other. A distance greater than 10 cannot be considered close.
Anatolia_Chalcolithic
Least-squares method.
Using 1 population approximation:
1 Anatolia_Chalcolithic @ 0
2 Anatolia_Bronze_Age @ 11,805973
3 Greek_Cappadocia @ 13,443617
4 South_Italian @ 14,011506
5 Cyprian @ 15,958764
6 Sephardic_Jewish @ 17,037429
7 Central_Greek @ 17,24864
8 Italian_Jewish @ 17,53137
9 East_Sicilian @ 17,655078
10 Italian_Abruzzo @ 19,476547
211 iterations.
Anatolia_Bronze_Age
Least-squares method.
Using 1 population approximation:
1 Anatolia_Bronze_Age @ 0,453767
2 Cyprian @ 7,171295
3 Greek_Cappadocia @ 10,516959
4 Anatolia_Chalcolithic @ 11,841659
5 Lebanese_Muslim @ 12,632653
6 Lebanese_Christian @ 14,350529
7 Samaritan @ 14,435627
8 Syrian @ 15,324154
9 Sephardic_Jewish @ 16,596795
10 Armenian_West @ 17,191345
211 iterations.
Greek_Cappadocia
Least-squares method.
Using 1 population approximation:
1 Greek_Cappadocia @ 0,245893
2 Armenian_West @ 10,245416
3 Anatolia_Bronze_Age @ 10,41903
4 Greek_Pontus @ 10,828287
5 Cyprian @ 11,707179
6 Assyrian @ 12,161285
7 Lebanese_Muslim @ 12,184882
8 Turk_Cappadocia @ 13,231142
9 Anatolia_Chalcolithic @ 13,441605
10 Turk_Anatolia @ 14,188997
211 iterations.


SOURCES:
- The Demographic Development of the First Farmers in Anatolia
- Genetic origins of the Minoans and Mycenaeans
- www.familytreedna.com/groups/oghuz-turks
Yazar:


